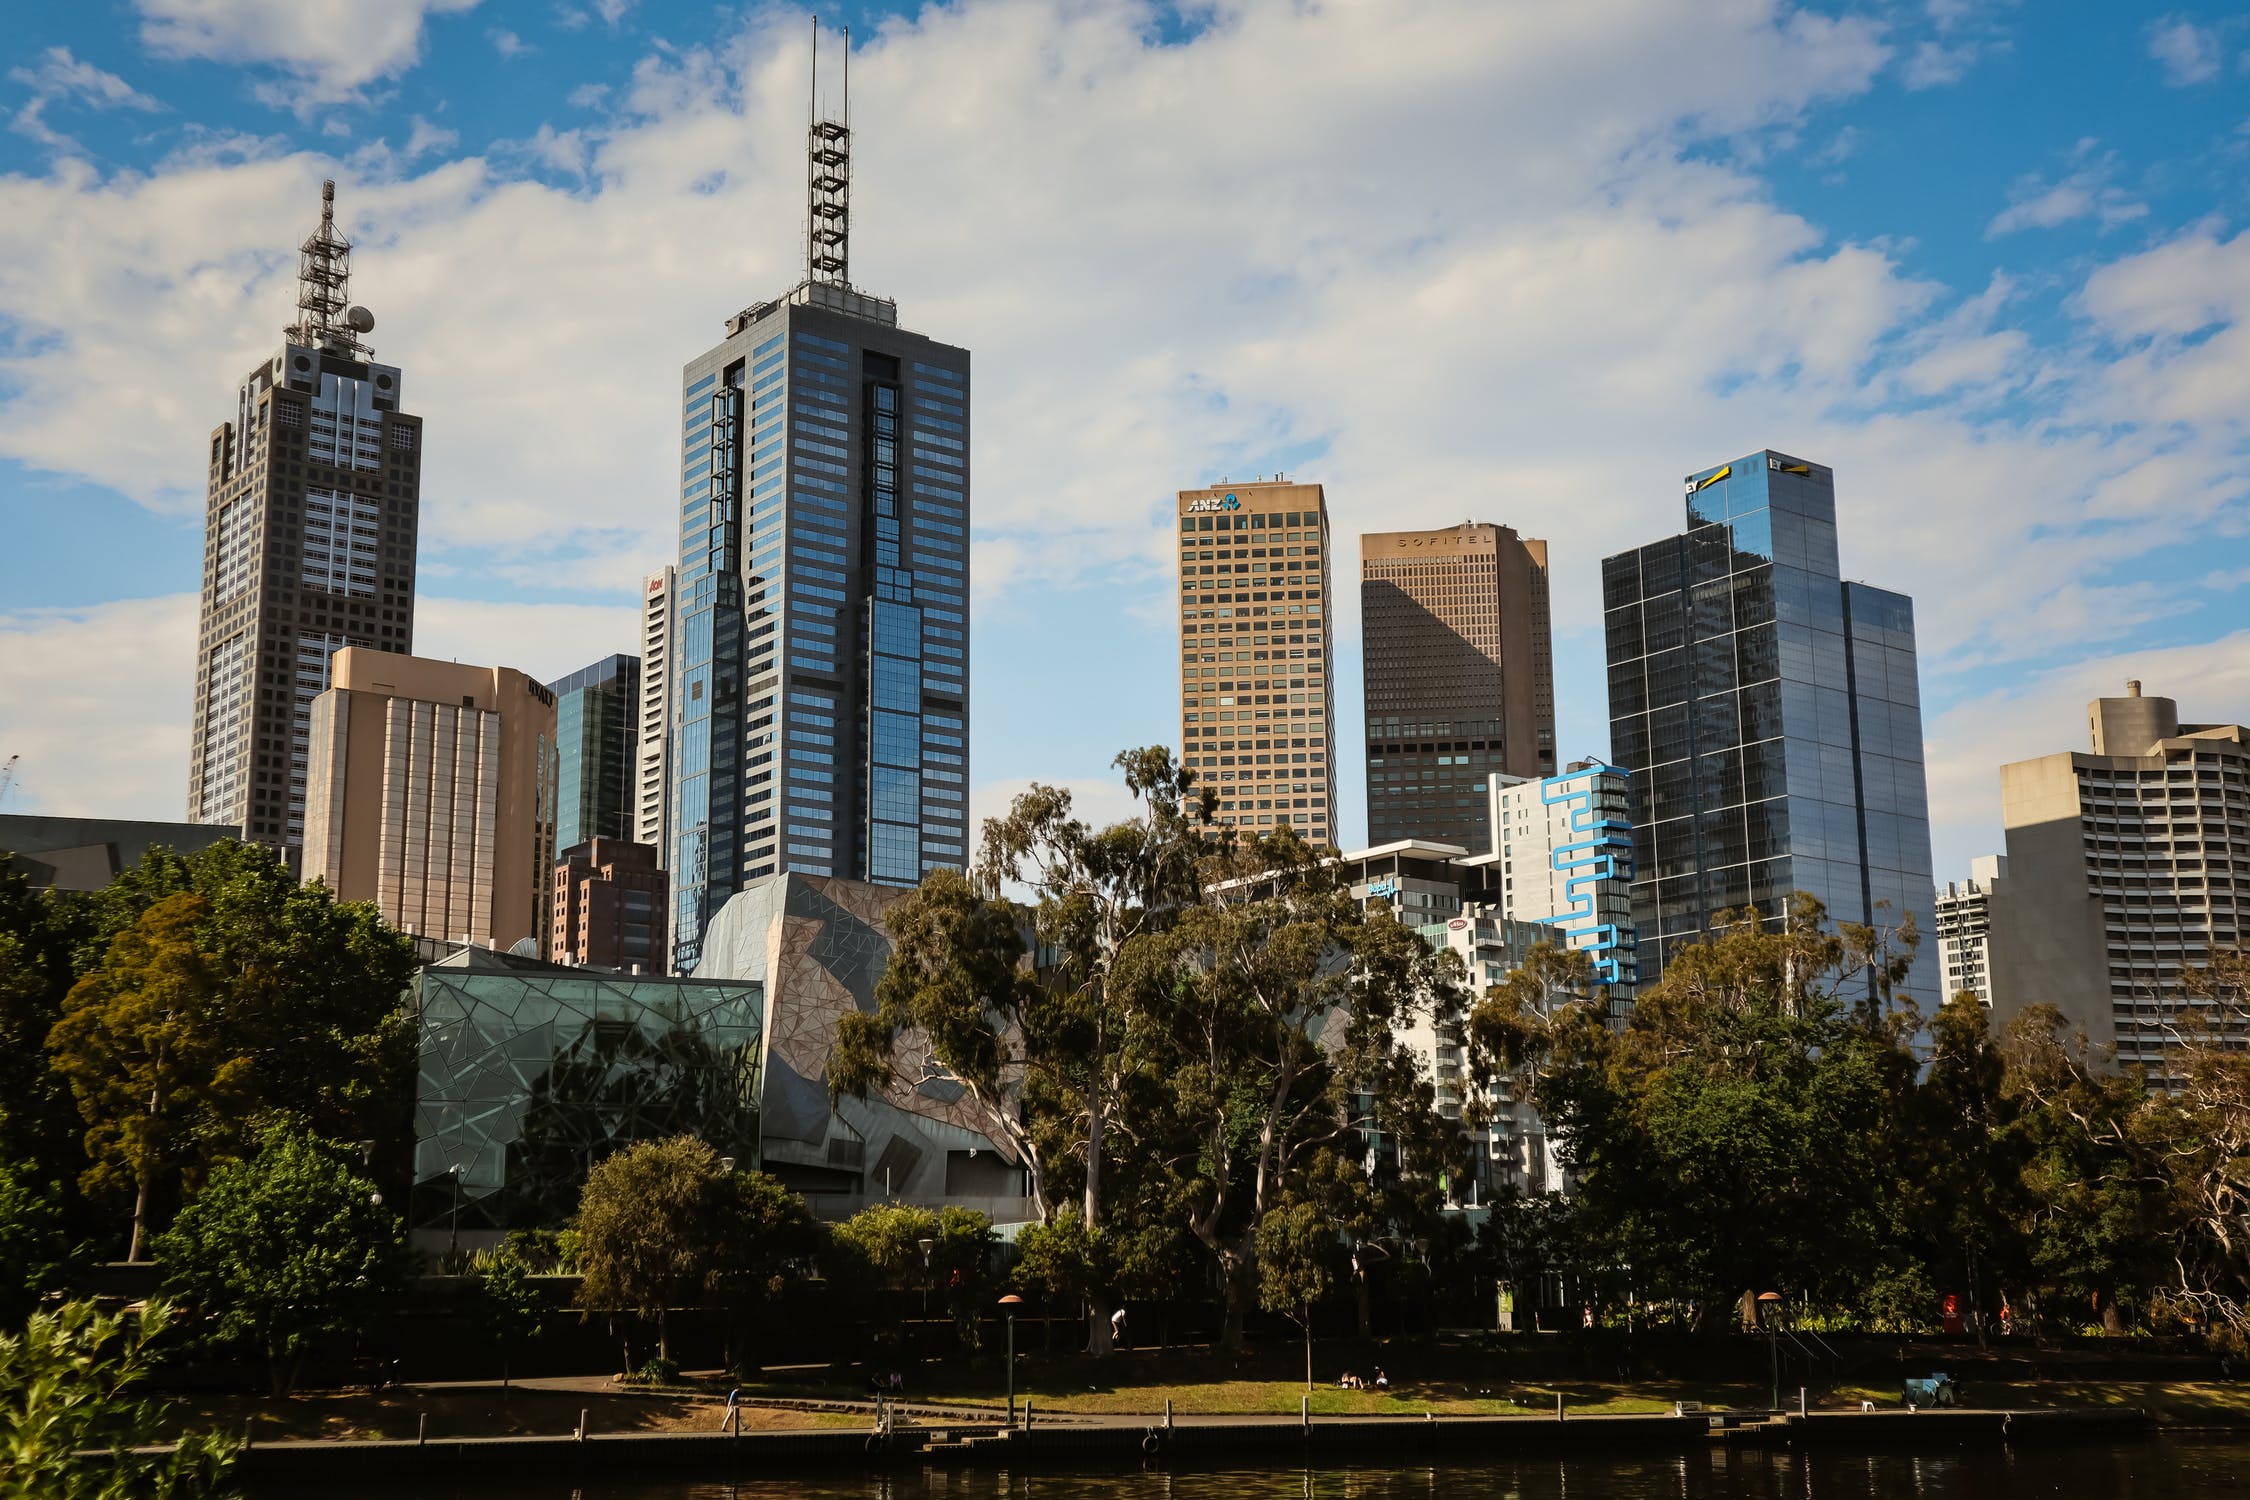
The Melbourne property market has had some capital growth variances in the last three months to September 2018. Mount Eliza takes the top of the table with an impressive 17.60% change from June 2018 – September 2018. The results below show that a combination of inner city and outer city suburbs have presented positive returns.
*Only suburbs with at least 30 sales in the relevant quarter are included.
Here is a currently list of the Top Growth Suburbs by Median House Price as at September 2018.
| Suburb | Sep-18: Median | Jun-18: Median | Quarterly Change |
| MOUNT ELIZA | $1,437,500 | $1,222,500 | 17.60% |
| ESSENDON | $1,700,000 | $1,500,000 | 13.30% |
| KEYSBOROUGH | $872,750 | $780,000 | 11.90% |
| COBURG | $1,050,000 | $965,000 | 8.80% |
| GREENVALE | $760,000 | $715,000 | 6.30% |
| NARRE WARREN SOUTH | $660,000 | $630,000 | 4.80% |
| WHEELERS HILL | $1,116,500 | $1,068,000 | 4.50% |
| EPPING | $632,500 | $605,000 | 4.50% |
| CAROLINE SPRINGS | $646,500 | $625,500 | 3.40% |
| SUNBURY | $577,750 | $560,000 | 3.20% |
| CRANBOURNE NORTH | $611,000 | $593,000 | 3.00% |
| HOPPERS CROSSING | $581,000 | $565,000 | 2.80% |
| CARRUM DOWNS | $590,000 | $575,000 | 2.60% |
| LILYDALE | $727,525 | $712,000 | 2.20% |
| BRIGHTON EAST | $1,940,000 | $1,905,000 | 1.80% |
| RINGWOOD EAST | $881,250 | $870,000 | 1.30% |
| CRANBOURNE WEST | $548,500 | $542,000 | 1.20% |
| WYNDHAM VALE | $485,000 | $480,000 | 1.00% |
| POINT COOK | $677,500 | $672,000 | 0.80% |
| ST ALBANS | $638,500 | $636,500 | 0.30% |
Source – This information has been collected by the Real Estate Institute of Victoria Ltd (REIV). The most authoritative source for information on the Victorian property market. * denotes less than 30 sales in the quarter
While we have taken care to ensure the information above is true and correct at the time of publication, changes in circumstances and legislation after the displayed date may impact the accuracy of this article. If you want to learn more, please contact us. We welcome the opportunity to assist you.
Oct 2018

